Network Data Visualization graph using SigmaJS
08 Jul 2014Sometimes its necessary to display data in something other than a table! Why? For example, when working with large datasets then it makes more sense to aggregate the data and display in the form of some type of chart like a pie chart or bar chart. In other cases the data might be geospatial data in which case a map would make an appropriate visualization.
In todays post, I’ll demonstrate how its possible to render a Network data set using the SigmaJS library, in particular, using SigmaJS’s rather handy JSON parser. I’ll also demonstrate techniques for programmatically zooming into specific nodes by id using the SigmaJS Camera class.
Rendering a basic network graph
During this post I will work with a static JSON file that represents a small abstract network. The JSON file will be constructed so that it works out of the box with the SigmaJS JSON Parser class.
In order for the JSON file to work with the SigmaJS JSON Parser it must contain two arrays ‘edges’ and ‘nodes’. Here is the sample JSON file I will work with.
In order to convert his JSON file into a pretty Network visualization, we need to host the file somewhere. The easiest way is to use python HTTP server to act as a basic server for us:
cd sigmajs_example
python -m SimpleHTTPServer
Now its possible to get the JSON file from the localhost server at port 8000. Like so:
open http://localhost:8000/data/network.jsonAfter running the above open command you should see the raw JSON data being displayed in the browser.
Obviously, some code is needed to manipulate this JSON file and turn it into our visualization. This can be done in JavaScript using SigmaJS! Firstly, a little HTML to get started to import the sigmajs files:
<script src="../lib/sigma.min.js"></script>
<script src="../lib/sigma.layout.forceAtlas2.min.js"></script>
<script src="../lib/sigma.parsers.json.min.js"></script>
Add a div tag as a placeholder for graph and give it some style so that we can see the graph output:
<style>
  #network-graph {
    top: 0;
    bottom: 0;
    left: 0;
    right: 0;
    position: absolute;
  }
</style>

<div id="network-graph"></div>
Finally, the interesting part, where we use the Sigma JS JSON Parser. In this first example, I demonstrate the most basic usage of the parser which is to pass in the JSON file and the container id where Sigma will render the output:
<script>
sigma.parsers.json( "/data/network.json", {container: 'network-graph'});
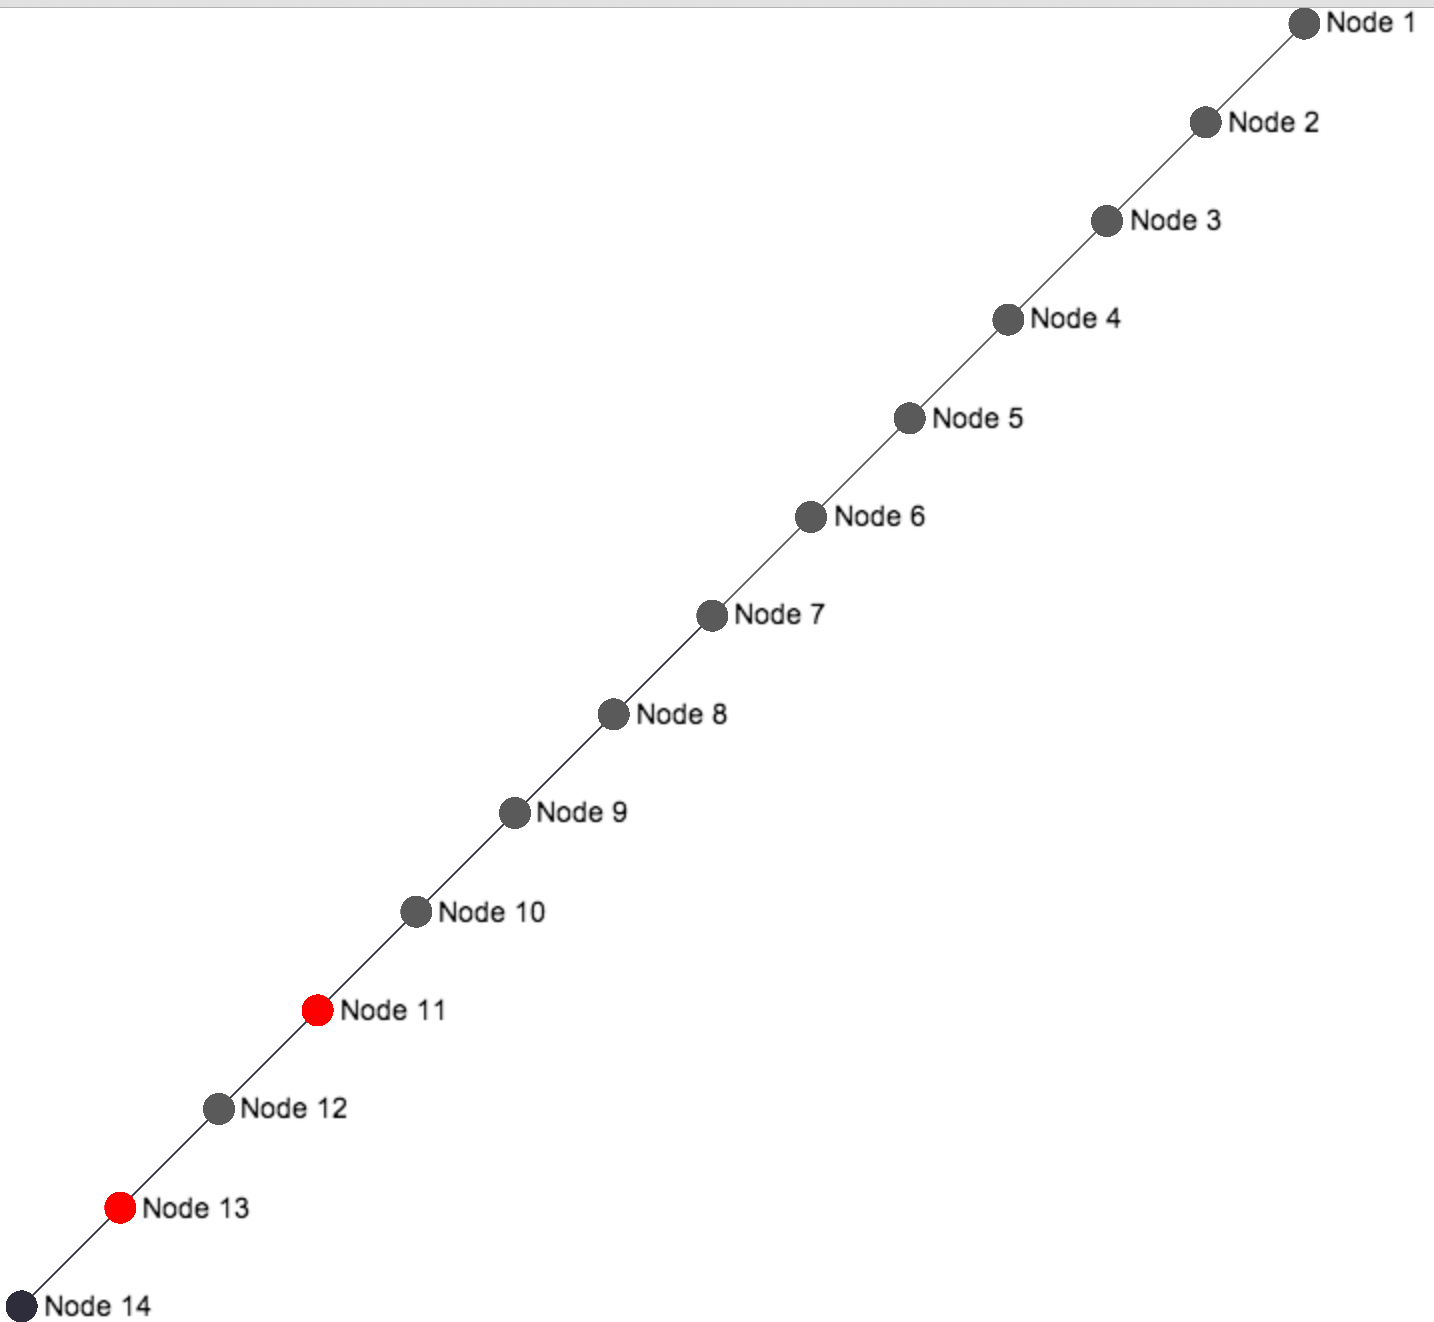
</script>The output in the browser should be as follows:
Layout the nodes in a circle
Now lets layout the nodes in a circle. Firstly, it’s important to know why the nodes in the previous example are being displayed in a diagonal line. It is due to the x and y values being set the way they are in the JSON file. For example Node 1 has x = 10, y = -10 which puts the node in the top right corner. For developers not used to drawing on the screen this is due to the y-axis being the reverse of what is usually expected say when drawing a graph. Usually the y-axis is positive going up. However, with screen drawing it is negative going up.
Another thing to note is that the graph always draws to the extents (except when there is only one node in which case it is always rendered in the centre of the screen). So if there two nodes with the following nodes array in the JSON file:
"nodes": [
  {
    "id": "1",
    "label": "Node 1",
    "x": 0,
    "y": 0
  },
  {
    "id": "2",
    "label": "Node 2"
    "x": 1,
    "y": 1
  }
]
Then the output is two nodes diagonally opposite each other:
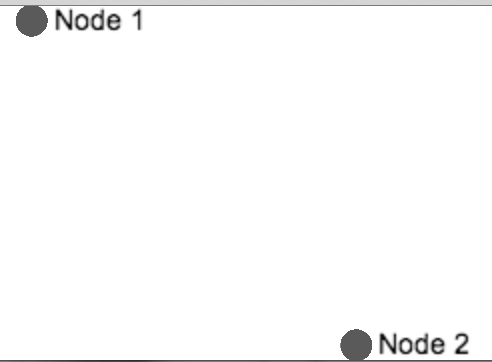
As we add more nodes to the collection, at further and further x and y co-ordinates the diagram will spread out naturally.
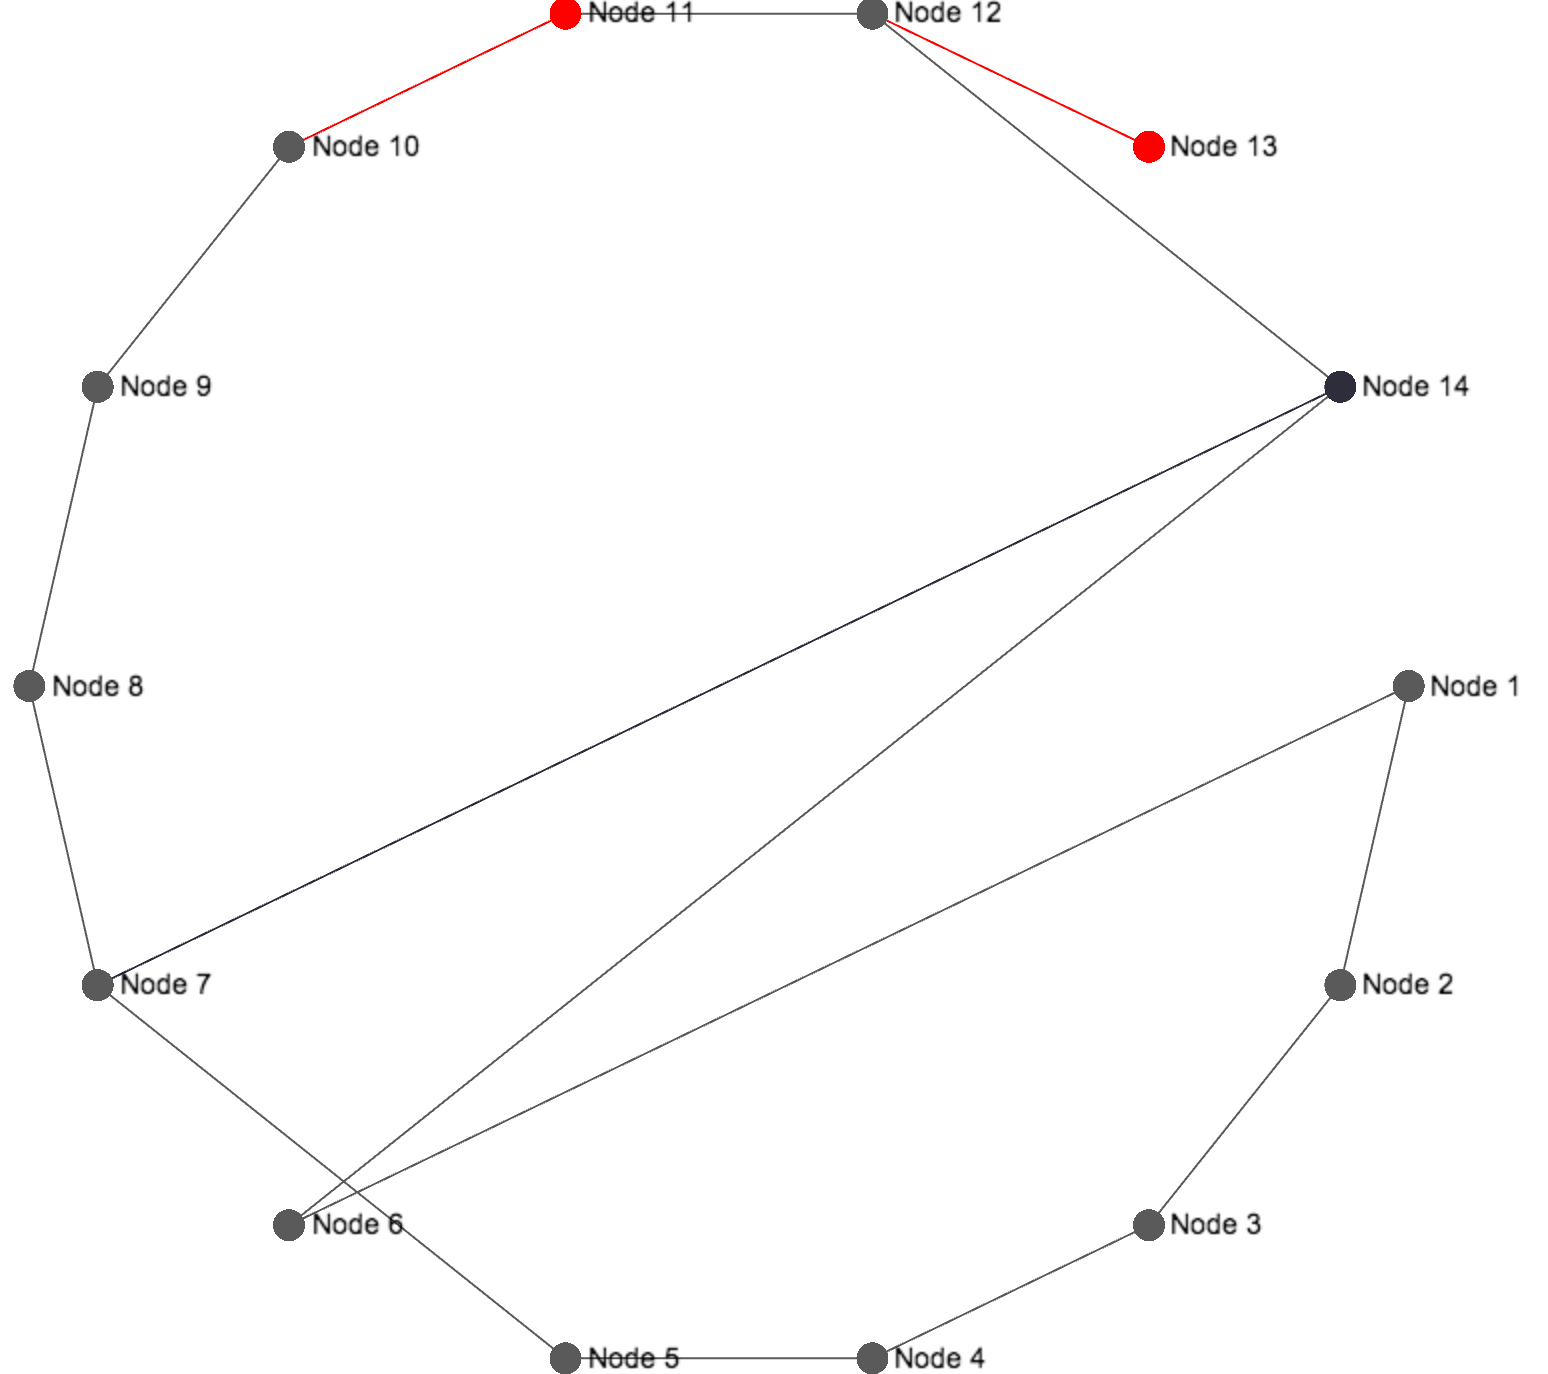
So back to the circlular representation of our network. If we want to do this we can borrow from the web. In this Github Issue thread there is a formula for rendering nodes as a circle:
sigmaInstance.graph.nodes().forEach(function(node, i, a) {
  node.x = Math.cos(Math.PI * 2 * i / a.length);
  node.y = Math.sin(Math.PI * 2 * i / a.length);
});
Where does the sigmaInstance variable come from? Well, back to our Sigma JSON Parser API, we can see there is room for a call back function which is passed, you guessed it, an instance of sigma! The full JS code looks like this (renamed sigmaInstance to ‘s’):
sigma.parsers.json( "/data/network.json",

  {container: 'network-graph'},

  function(s) { //This function is passed an instance of Sigma s

    //Initialize nodes as a circle
    s.graph.nodes().forEach(function(node, i, a) {
      node.x = Math.cos(Math.PI * 2 * i / a.length);
      node.y = Math.sin(Math.PI * 2 * i / a.length);
    });

    //Call refresh to render the new graph
    s.refresh();
  });
Note the call to refresh to essentially redraw the graph on the screen. The output should appear like so:
Zoom into a specific node
Let’s say its necessary to pass a node id to a url parameter and have the graph render as normal, but afterwards zoom directly to that node on the graph. This could be useful for larger graph or for sharing links to specific nodes in the graph.
The way to go about solving this in SigmaJS is to:
- Grab the selected node id from the url
- Find the node with that id by looking through the nodes collection
- Use the SigmaJS Camera class to zoom in to the selected node
Here is the code to grab the selected node id from the url which I borrowed from one of these Stackoverflow answers:
function getParameterByName(name) {
  var match = RegExp('[?&]' + name + '=([^&]*)').exec(window.location.search);
  return match && decodeURIComponent(match[1].replace(/\+/g, ' '));
};
Since the passed in the parameter is node_id its possible to get that into a local variable as follows:
nodeId = parseInt(getParameterByName('node_id'));Next up is finding that node in the nodes array. Here is one solution:
s.graph.nodes().forEach(function(node, i, a) {
  if (node.id == nodeId) {
    selectedNode = node;
    return;
  }
});
Note its also possible to use the jQuery grep method for a more elegant approach to finding the node.
Finally, we can zoom to that node using the SigmaJS Camera class! Here is one way how it is done. Adjust the zoom ratio to see the node closer or further away. Note that this code should be surrounded by an if statement to check if the selectedNode is not undefined to avoid a JavaScript error.
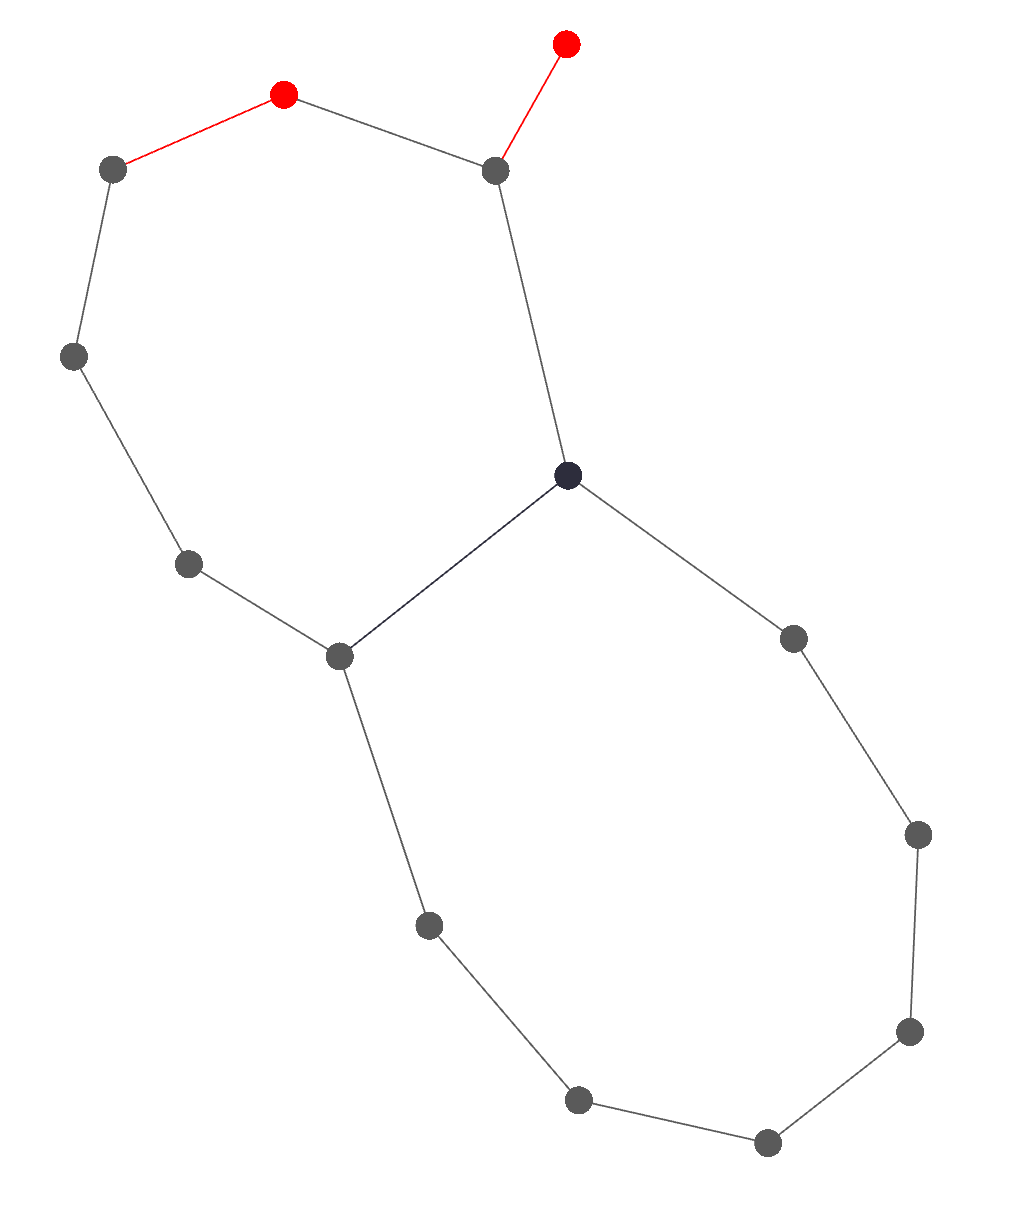
s.cameras[0].goTo({x:selectedNode['read_cam0:x'],y:selectedNode['read_cam0:y'],ratio:0.1});Layout the nodes using the force!
Finally, let’s look at applying the force! All we need to do is call the startForceAtlas2 function on the Sigma graph instance like so:
s.startForceAtlas2();In our example we want to call this after refresh so that the nodes are properly aligned in a circle before hand. The resulting output is as shown below:
Conclusion
Sigma.js is a powerful library for displaying network graphs. There are many powerful examples available on the web that demonstrate how to use this framework, for example datavisnetwork from moebio.com and French Senators
Despite other, more common, data vizualisation tools supporting network graphs (for example d3js) it is still worth using Sigma.js for network graphs especially if your application heavily depends on these type of vizualisations.
Here is an example application which contains all the above examples in one small download!